

COVID-19 Research, February 2021
On Seasonality and Transmission Dynamics
Talib Dbouk and Dimitris Drikakis, University of Nicosia. Published in Physics of Fluids on 2 February 2021.
The Study
Epidemic models do not account for the effects of climate conditions on the transmission dynamics of viruses. This study presents the vital relationship between weather seasonality, airborne virus transmission, and pandemic outbreaks over a whole year.
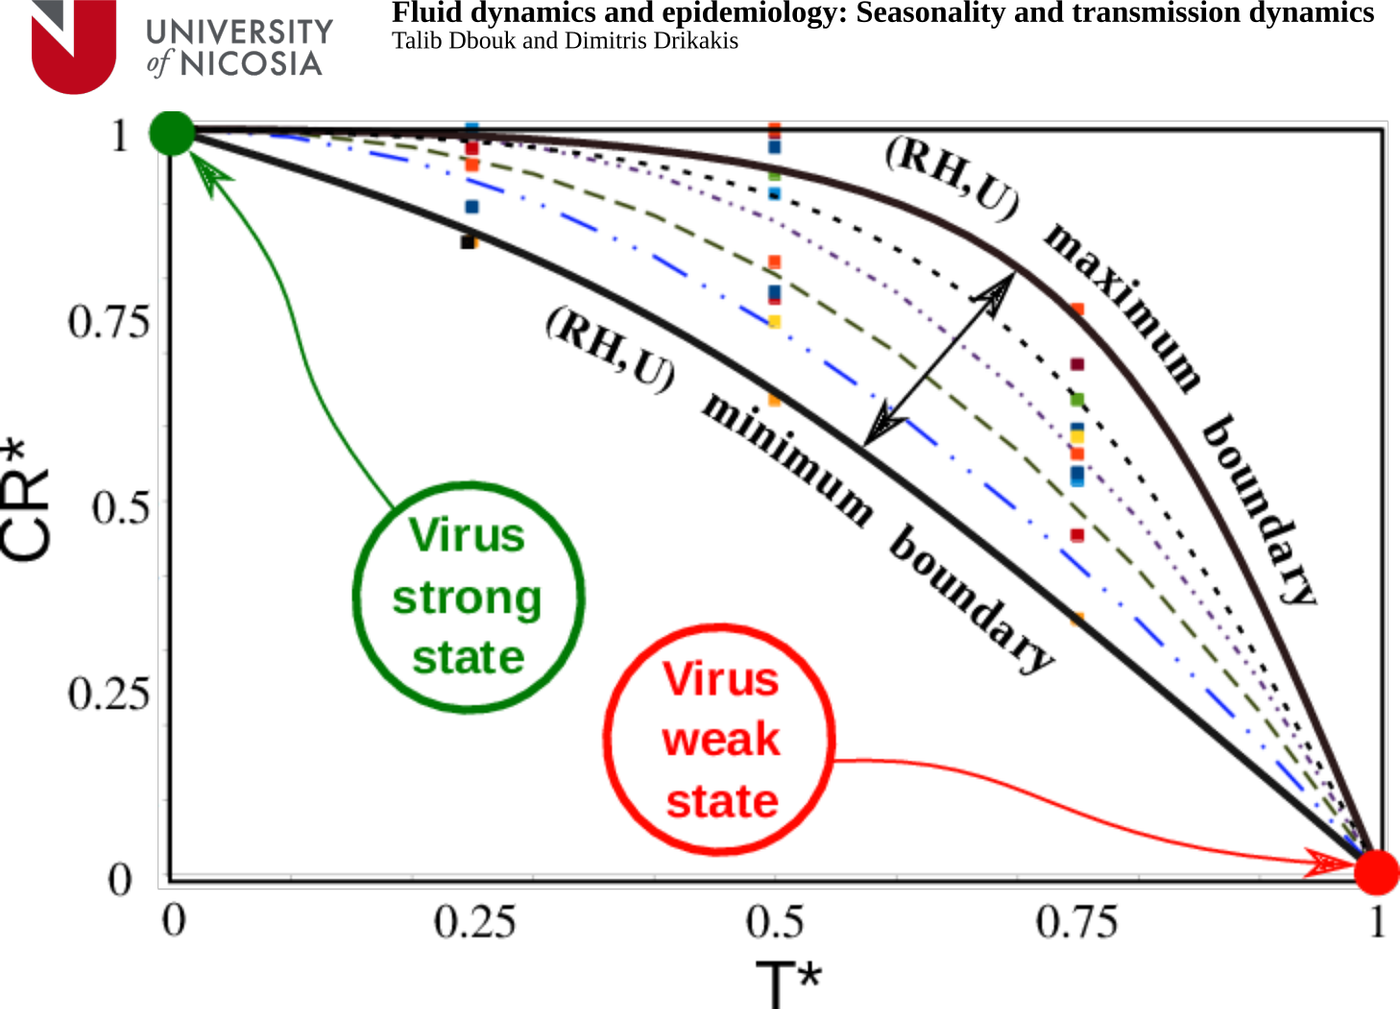
Using the data obtained from high-fidelity multi-phase, fluid dynamics simulations, we calculate the concentration rate of Coronavirus particles in contaminated saliva droplets and use it to derive a new Airborne Infection Rate (AIR) index.
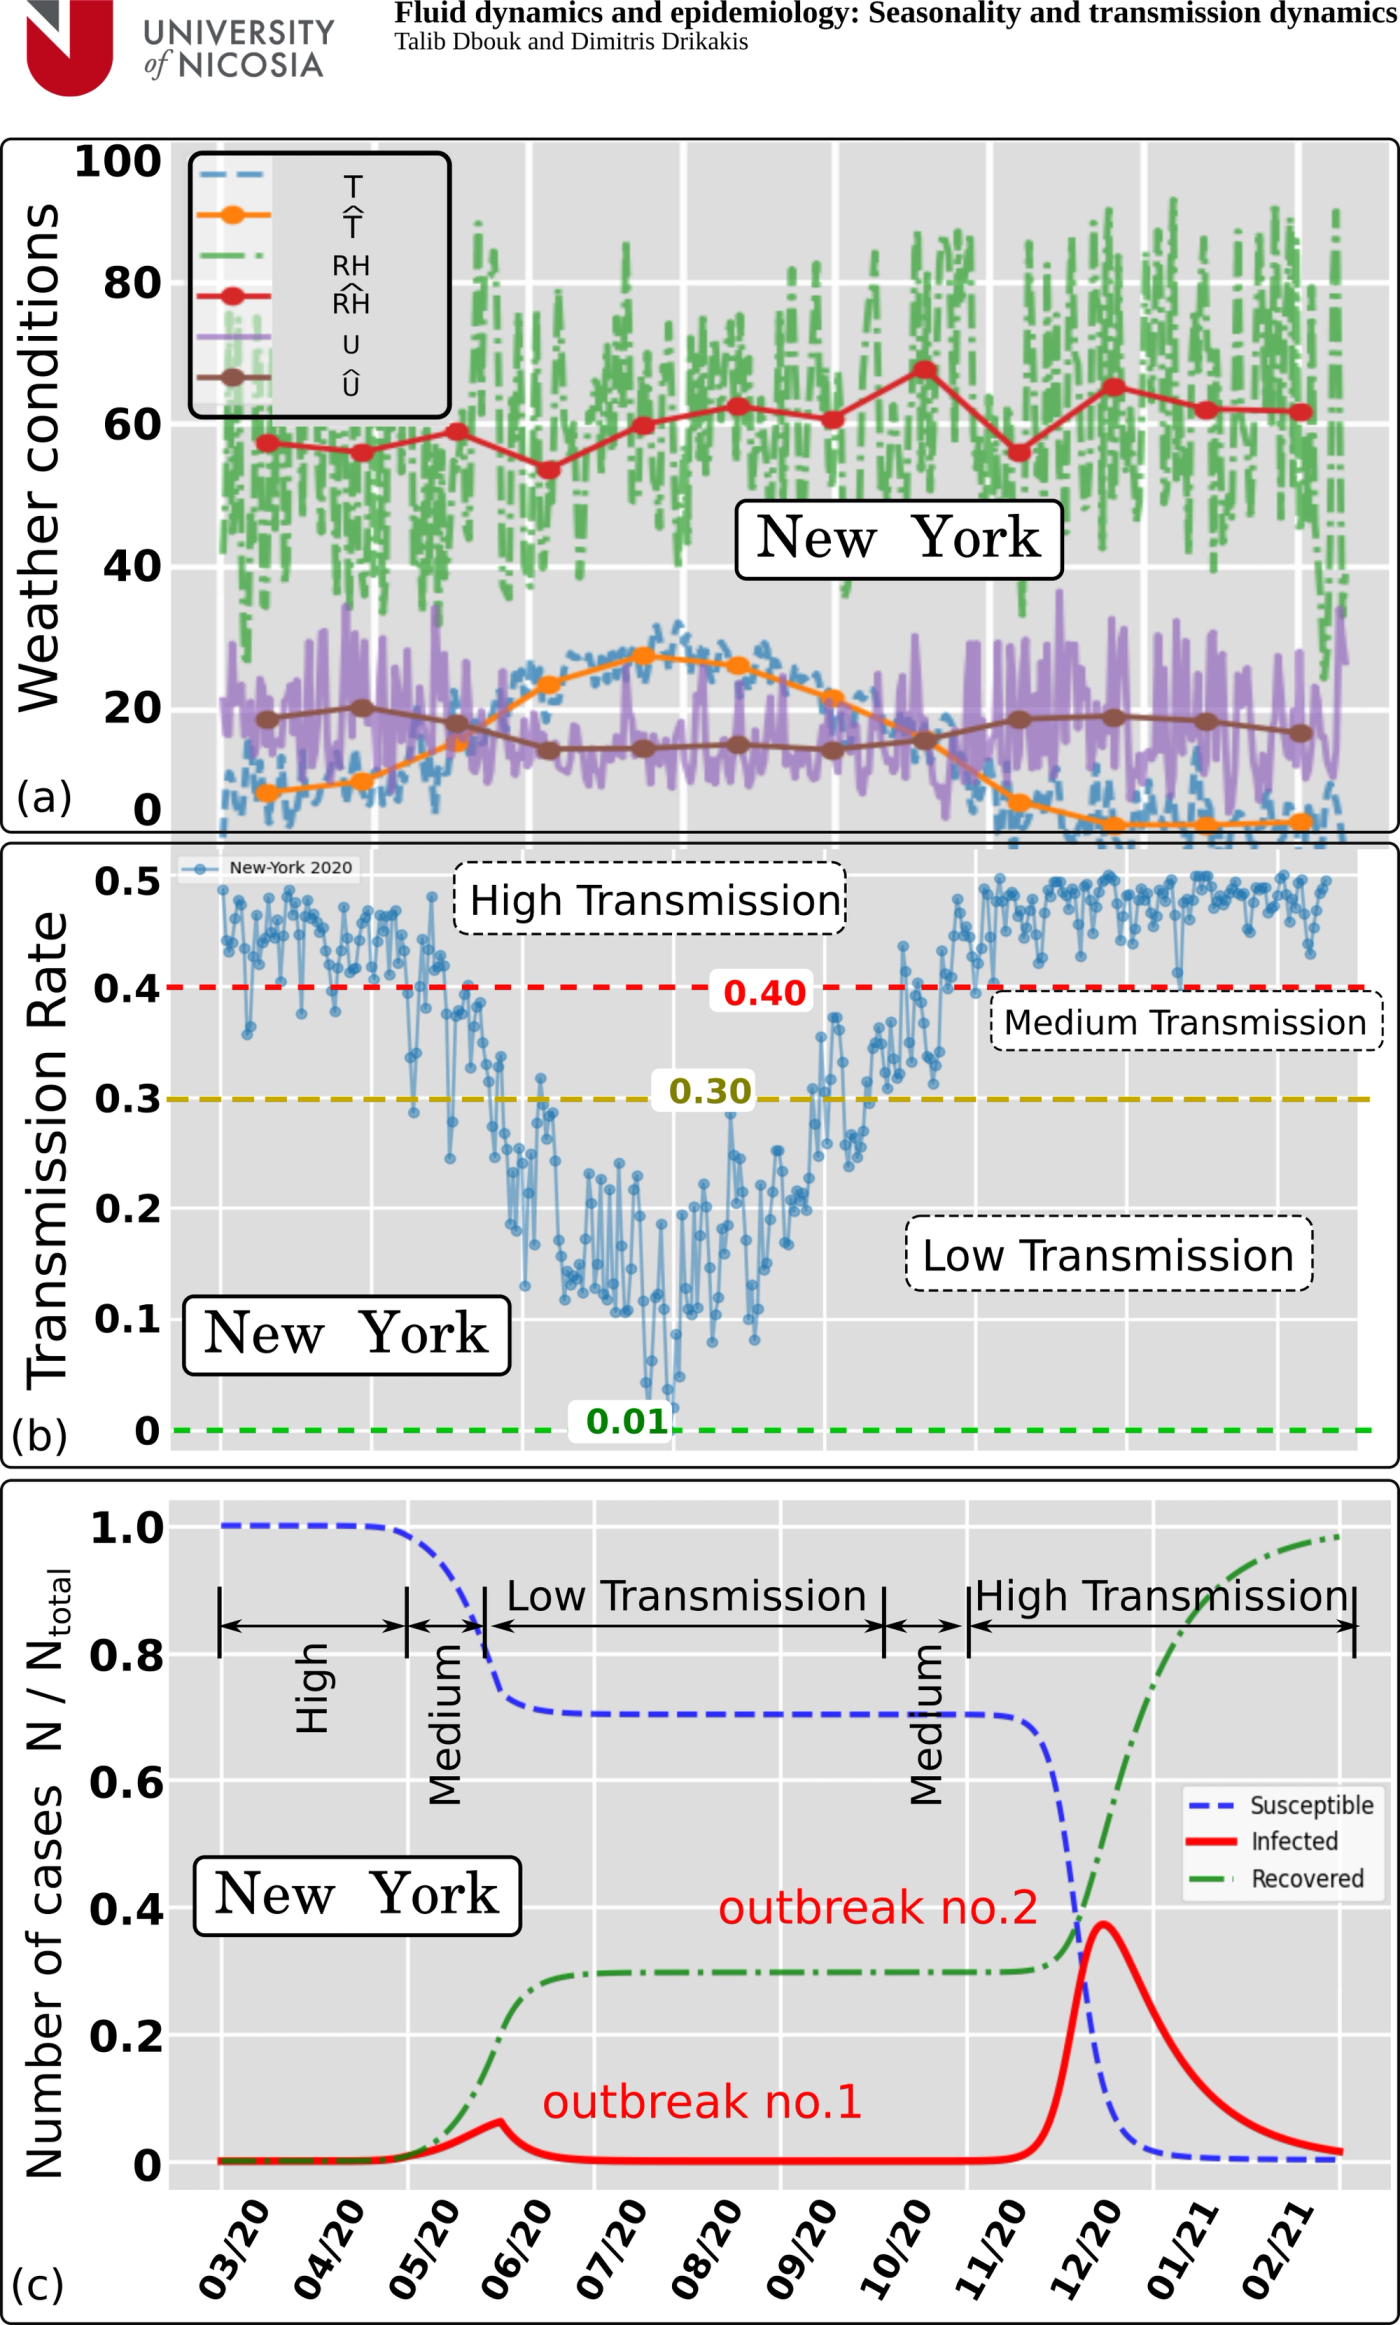
Then, combining the simplest form of an epidemiological model, the susceptible-infected-recovered, and the AIR index, we show through data evidence how weather seasonality induces two outbreaks per year, as it is observed with the COVID-19 pandemic worldwide.
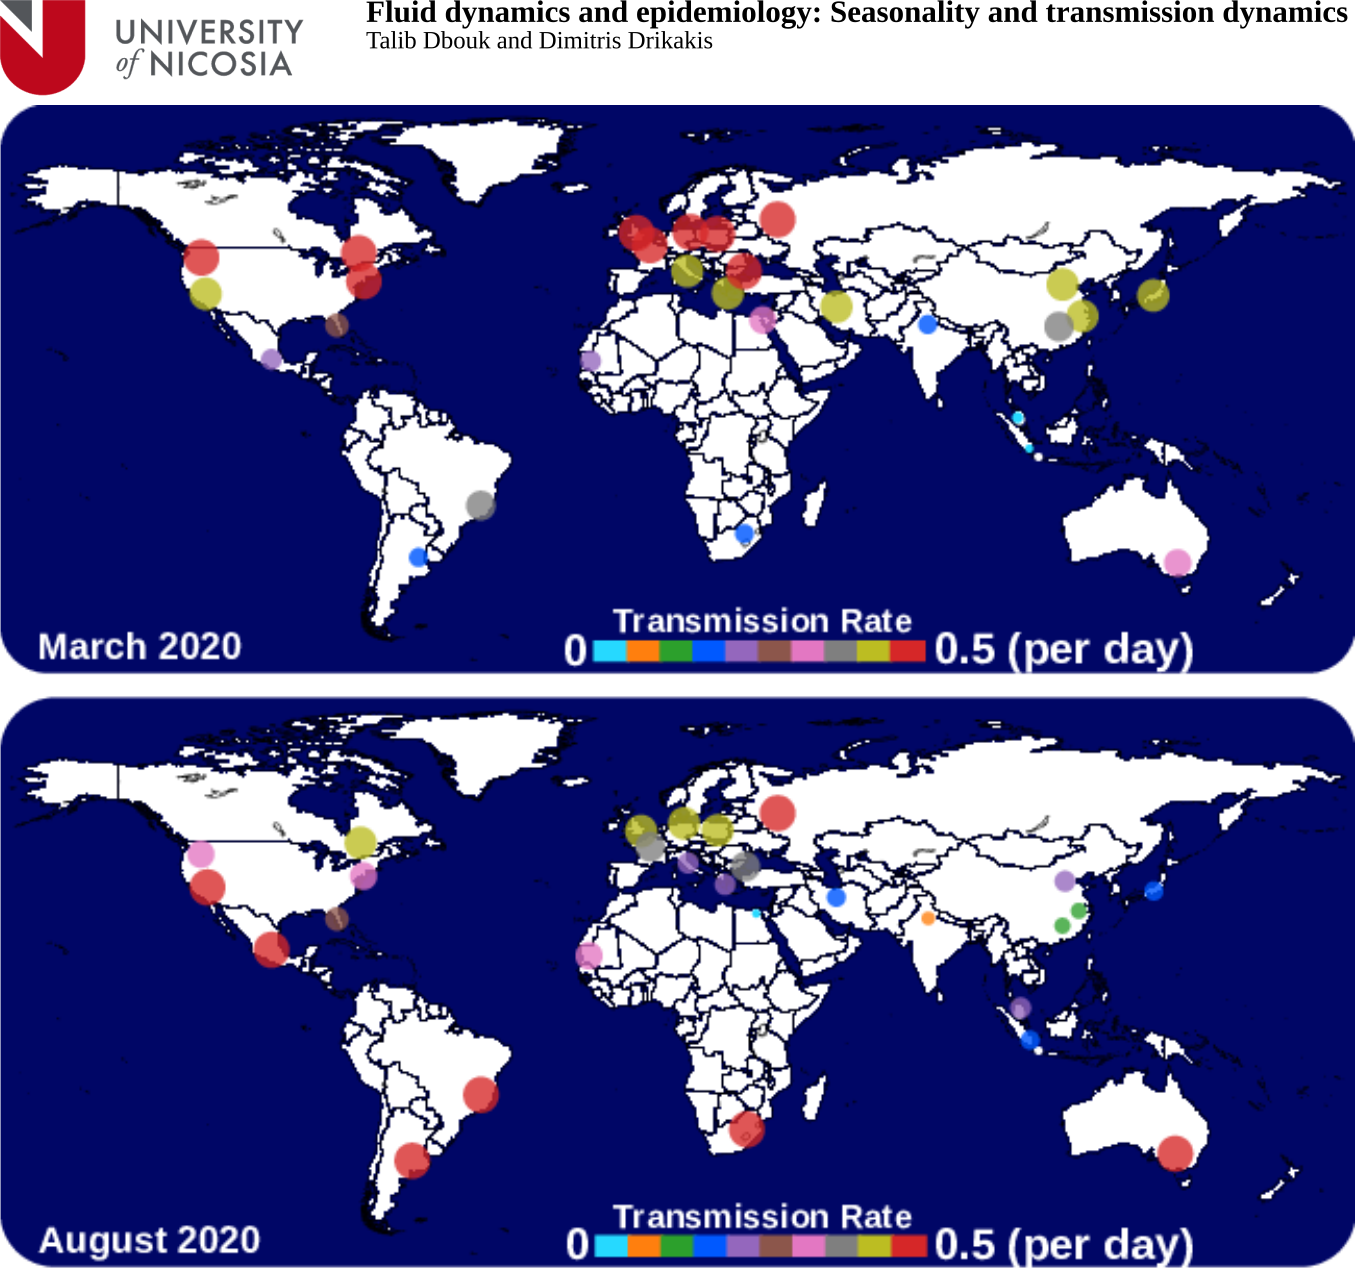
This study explains how pandemic outbreaks are associated with temperature, relative humidity, and wind speed changes independently of the particular season. For that reason, we propose that epidemiological models must incorporate climate effects to predict the pandemic curves behaviour on a long-term basis.
Dbouk, T. and Drikakis, D. Fluid dynamics and epidemiology: Seasonality and transmission dynamics. Physics of Fluids 33, 021901 (2021), published online 2 February 2021. doi.org/10.1063/5.0037640
What Does This Mean?
There exists a direct relationship between weather seasonality and the pandemic evolution in different countries. This new relationship between weather seasonality and airborne virus transmission is quantified in the present study. It is then introduced into the SIR epidemiological model. The new model predicts pandemic outbreaks connected with main weather parameters: temperature, wind speed, and relative humidity. The significant findings are:
- Weather plays an important role in the pandemic outbreaks. Therefore, it must be included in epidemiological predictions.
- The Airborne Infection Rate (AIR) index defined in this study through the concentration rate (CR) provides a direct link between multiphase fluid dynamics and the disease’s spread.
- The results suggest that two pandemic outbreaks per year are more likely a natural phenomenon directly related to the weather seasonality during a pandemic evolution. The above puts in question large scale, strict lockdowns, but, indeed, the decisions for the above are associated with broader socio-economic issues.
- We can slow down the spread of the disease but cannot stop a second wave. The social protective measures, the extensive testing and contact tracing using electronic tracking devices, and foremost checking everybody at the entry into a country and quarantine rules in designated places, would help reduce the virus’s spread.
- The proposed AIR index can be used in conjunction with any SIR or SIR-derived model.
Media and Press Materials
UNIC’s COVID-19 Response
During the pandemic, University of Nicosia faculty across a range of academic disciplines worked on research and analysis, and served in scientific and public policy roles supporting the COVID-19 response.
The university’s other COVID-19 research is gathered on COVID-19 Research.
Contact Information
For more information about this study, contact Professor Dimitris Drikakis at drikakis.d@unic.ac.cy.
Press Coverage
Articles and press mentions in global media about the research.
- Cyprus Mail: Coronavirus: Researchers say virus forecasts should focus on weather
- Phys.org: Temperature, humidity, wind predict second wave of pandemic
- News-Medical: Airborne Infection Rate index predicts timing of second wave of pandemic
- Newswise: Temperature, Humidity, Wind Predict Second Wave of Pandemic
- Bioengineer.org: Temperature, humidity, wind predict second wave of pandemic
- Blick: Könnte ein Lockdown mit Wetterdaten vermieden werden?
- Daily Geek Show: Covid-19 : la seconde vague de la pandémie a été largement influencée par la météo
- Kopalnia Wiedzy: Fale pandemii mogą być powodowane zmiennością pogodową. Każdego roku będą dwie fale?
- Proto Thema: Κορωνοϊός: Τι ρόλο παίζει ο καιρός στην εξάπλωση της πανδημίας, τι λέει νέα έρευνα
- Sigmalive: Δρικάκης: Γιατί ήταν «αναπόφευκτο» το 2ο κύμα, τι υποστηρίζει το μοντέλο του
- Kathimerini Cyprus: Οι καιρικές συνθήκες πρέπει να λαμβάνονται υπόψη στην Πρόβλεψη ενός Δεύτερου Κύματος μιας Πανδημίας