

2 April 2026
Front-End Analytics in Blackboard Ultra
A range of built-in front-end analytics tools that allow instructors to monitor student engagement, performance, and activity directly within the course interface.

Course Activity & Engagement Analytics
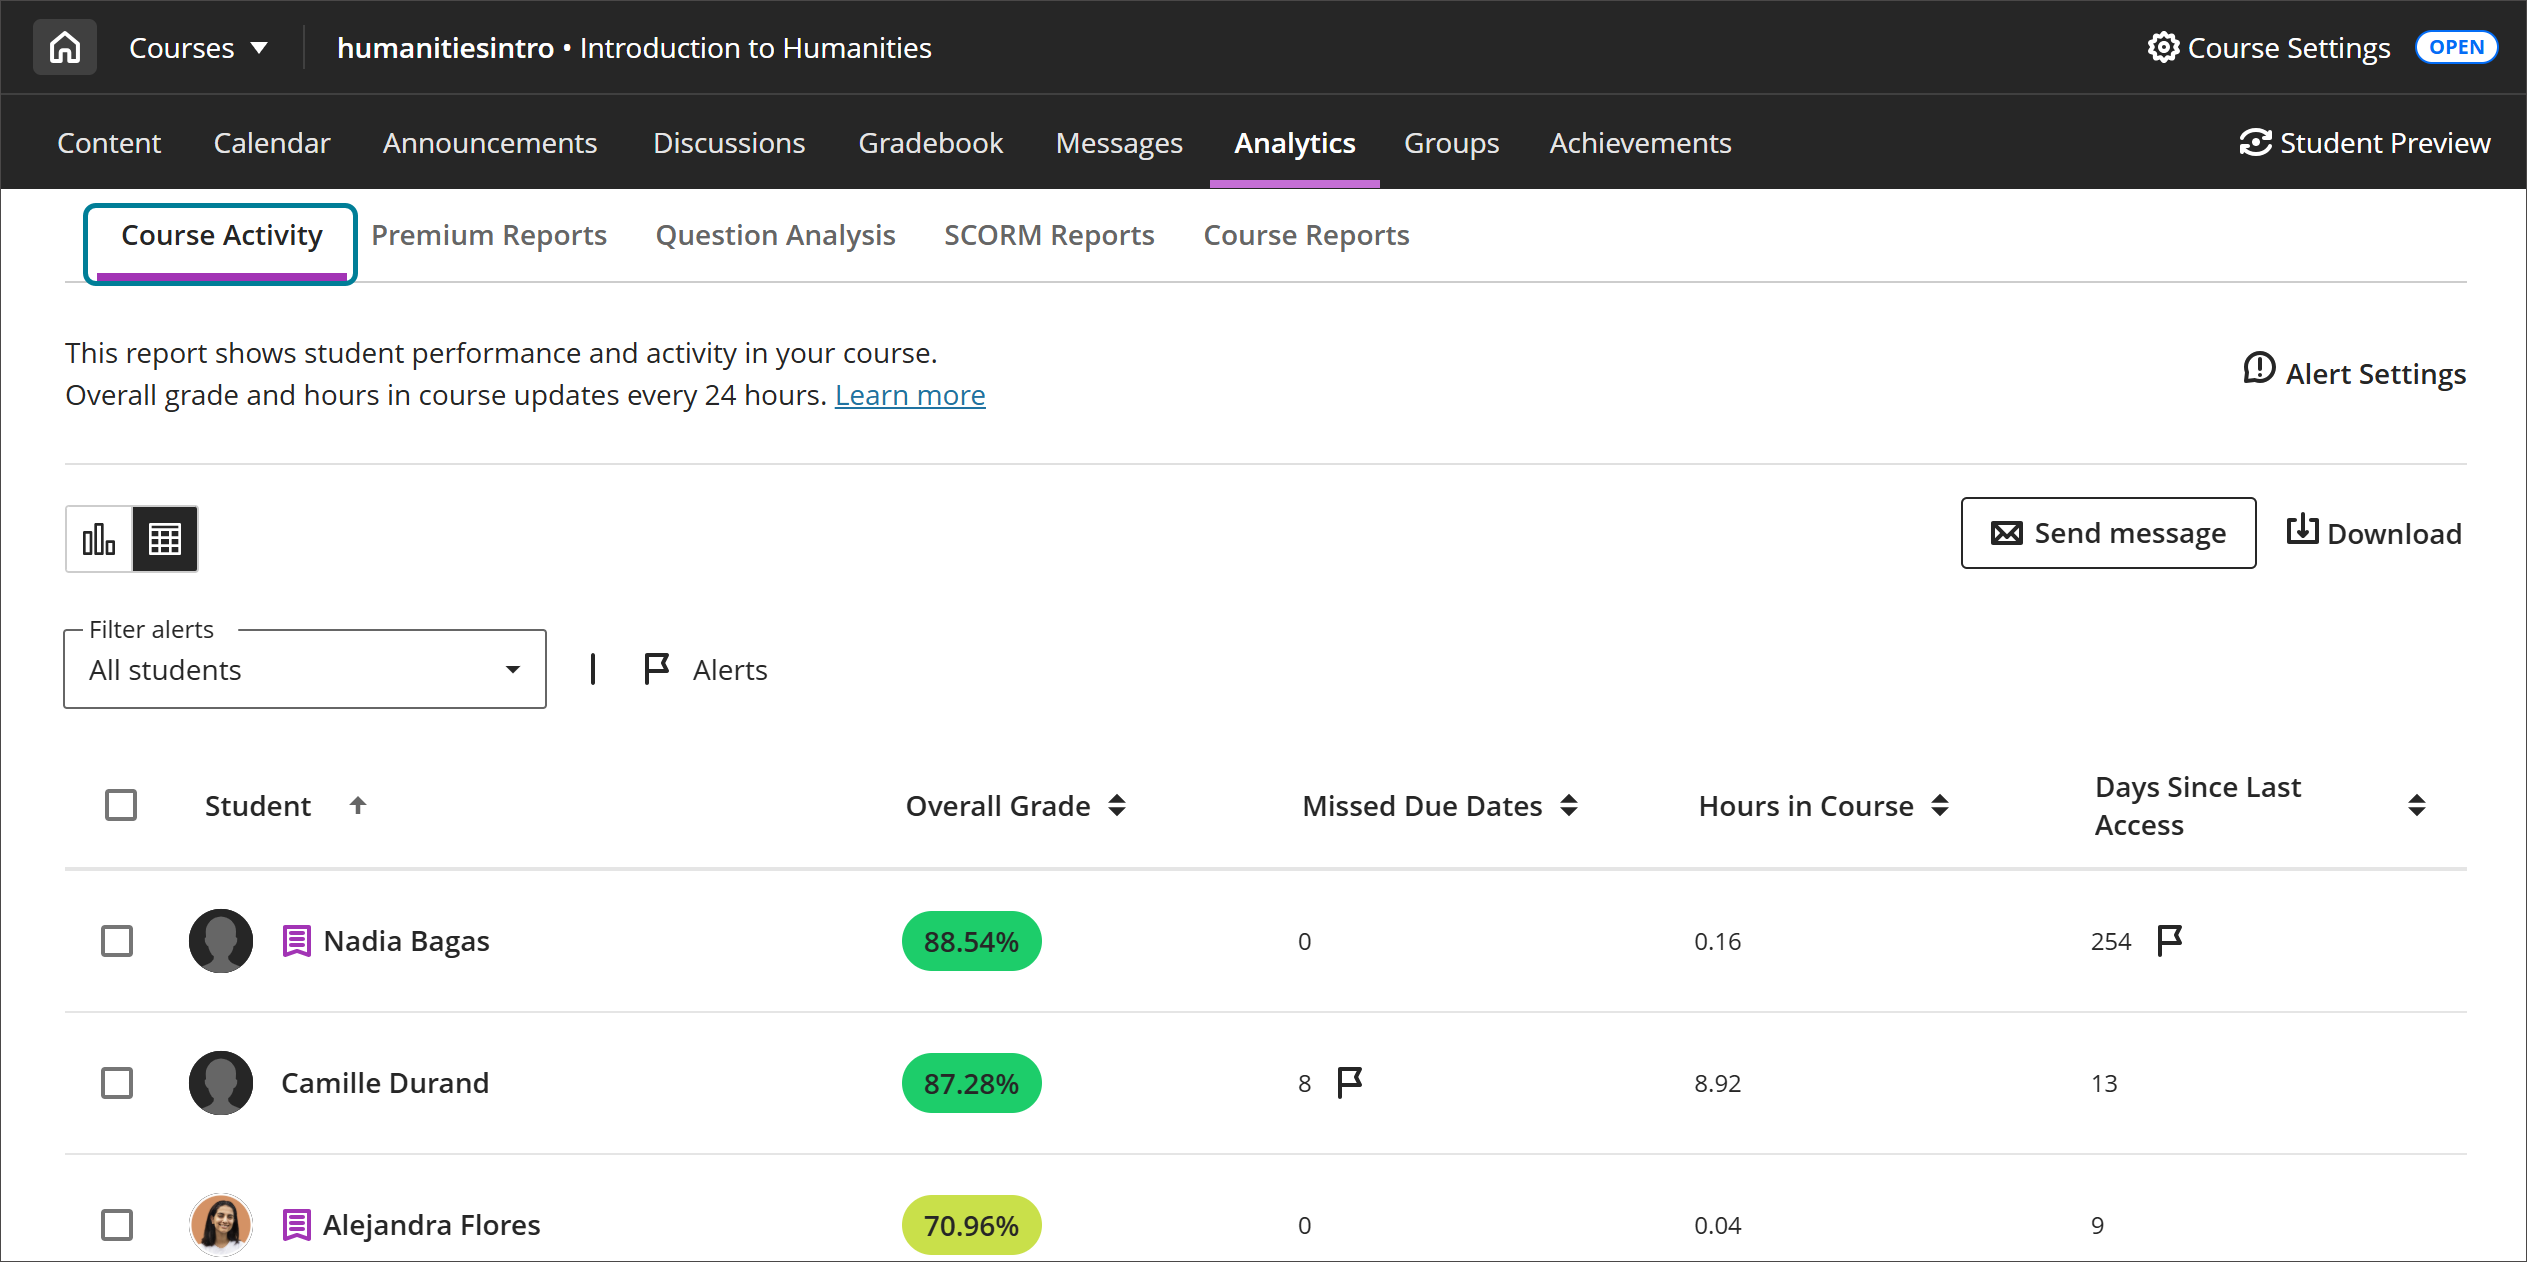
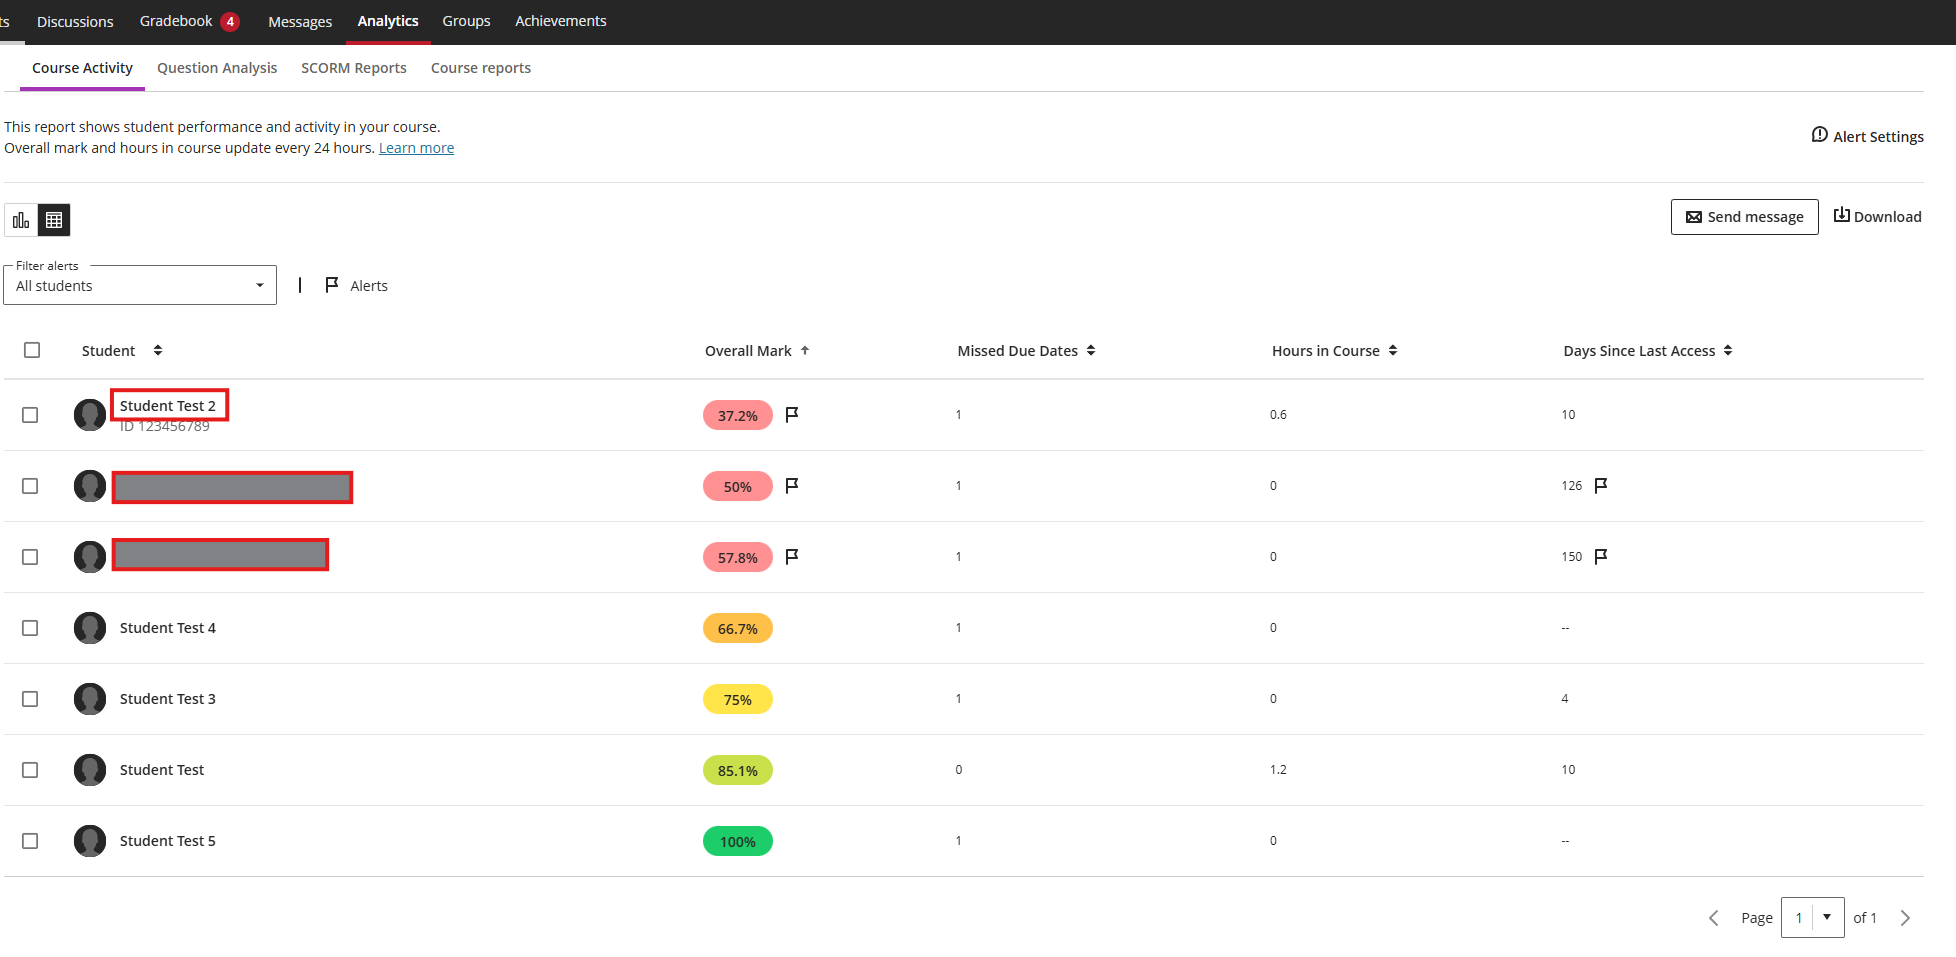
The Course Activity Report is the primary analytics dashboard in Blackboard Ultra and provides a consolidated overview of how students are engaging with the course. It combines behavioural data (such as time spent and access frequency) with academic data (such as grades), allowing instructors to interpret engagement in a meaningful context.
Rather than presenting raw logs, the report translates activity into indicators that are easier to interpret, such as “days since last access” or “hours in course”. This makes it particularly useful for quickly scanning a cohort and identifying patterns without needing technical expertise. The inclusion of visualisations like scatter plots allows instructors to see correlations—for example, whether higher engagement aligns with better performance.
Key metrics include:
- Overall grade
- Hours spent in the course
- Days since last access
- Missed due dates
These metrics are visualised in:
- Table view (student-by-student data)
- Scatter plots comparing activity vs performance
Instructors can also:
- Set alerts for low engagement or poor performance
- Identify at-risk students based on inactivity or missed deadlines
Use case:
Early identification of disengaged or struggling students.
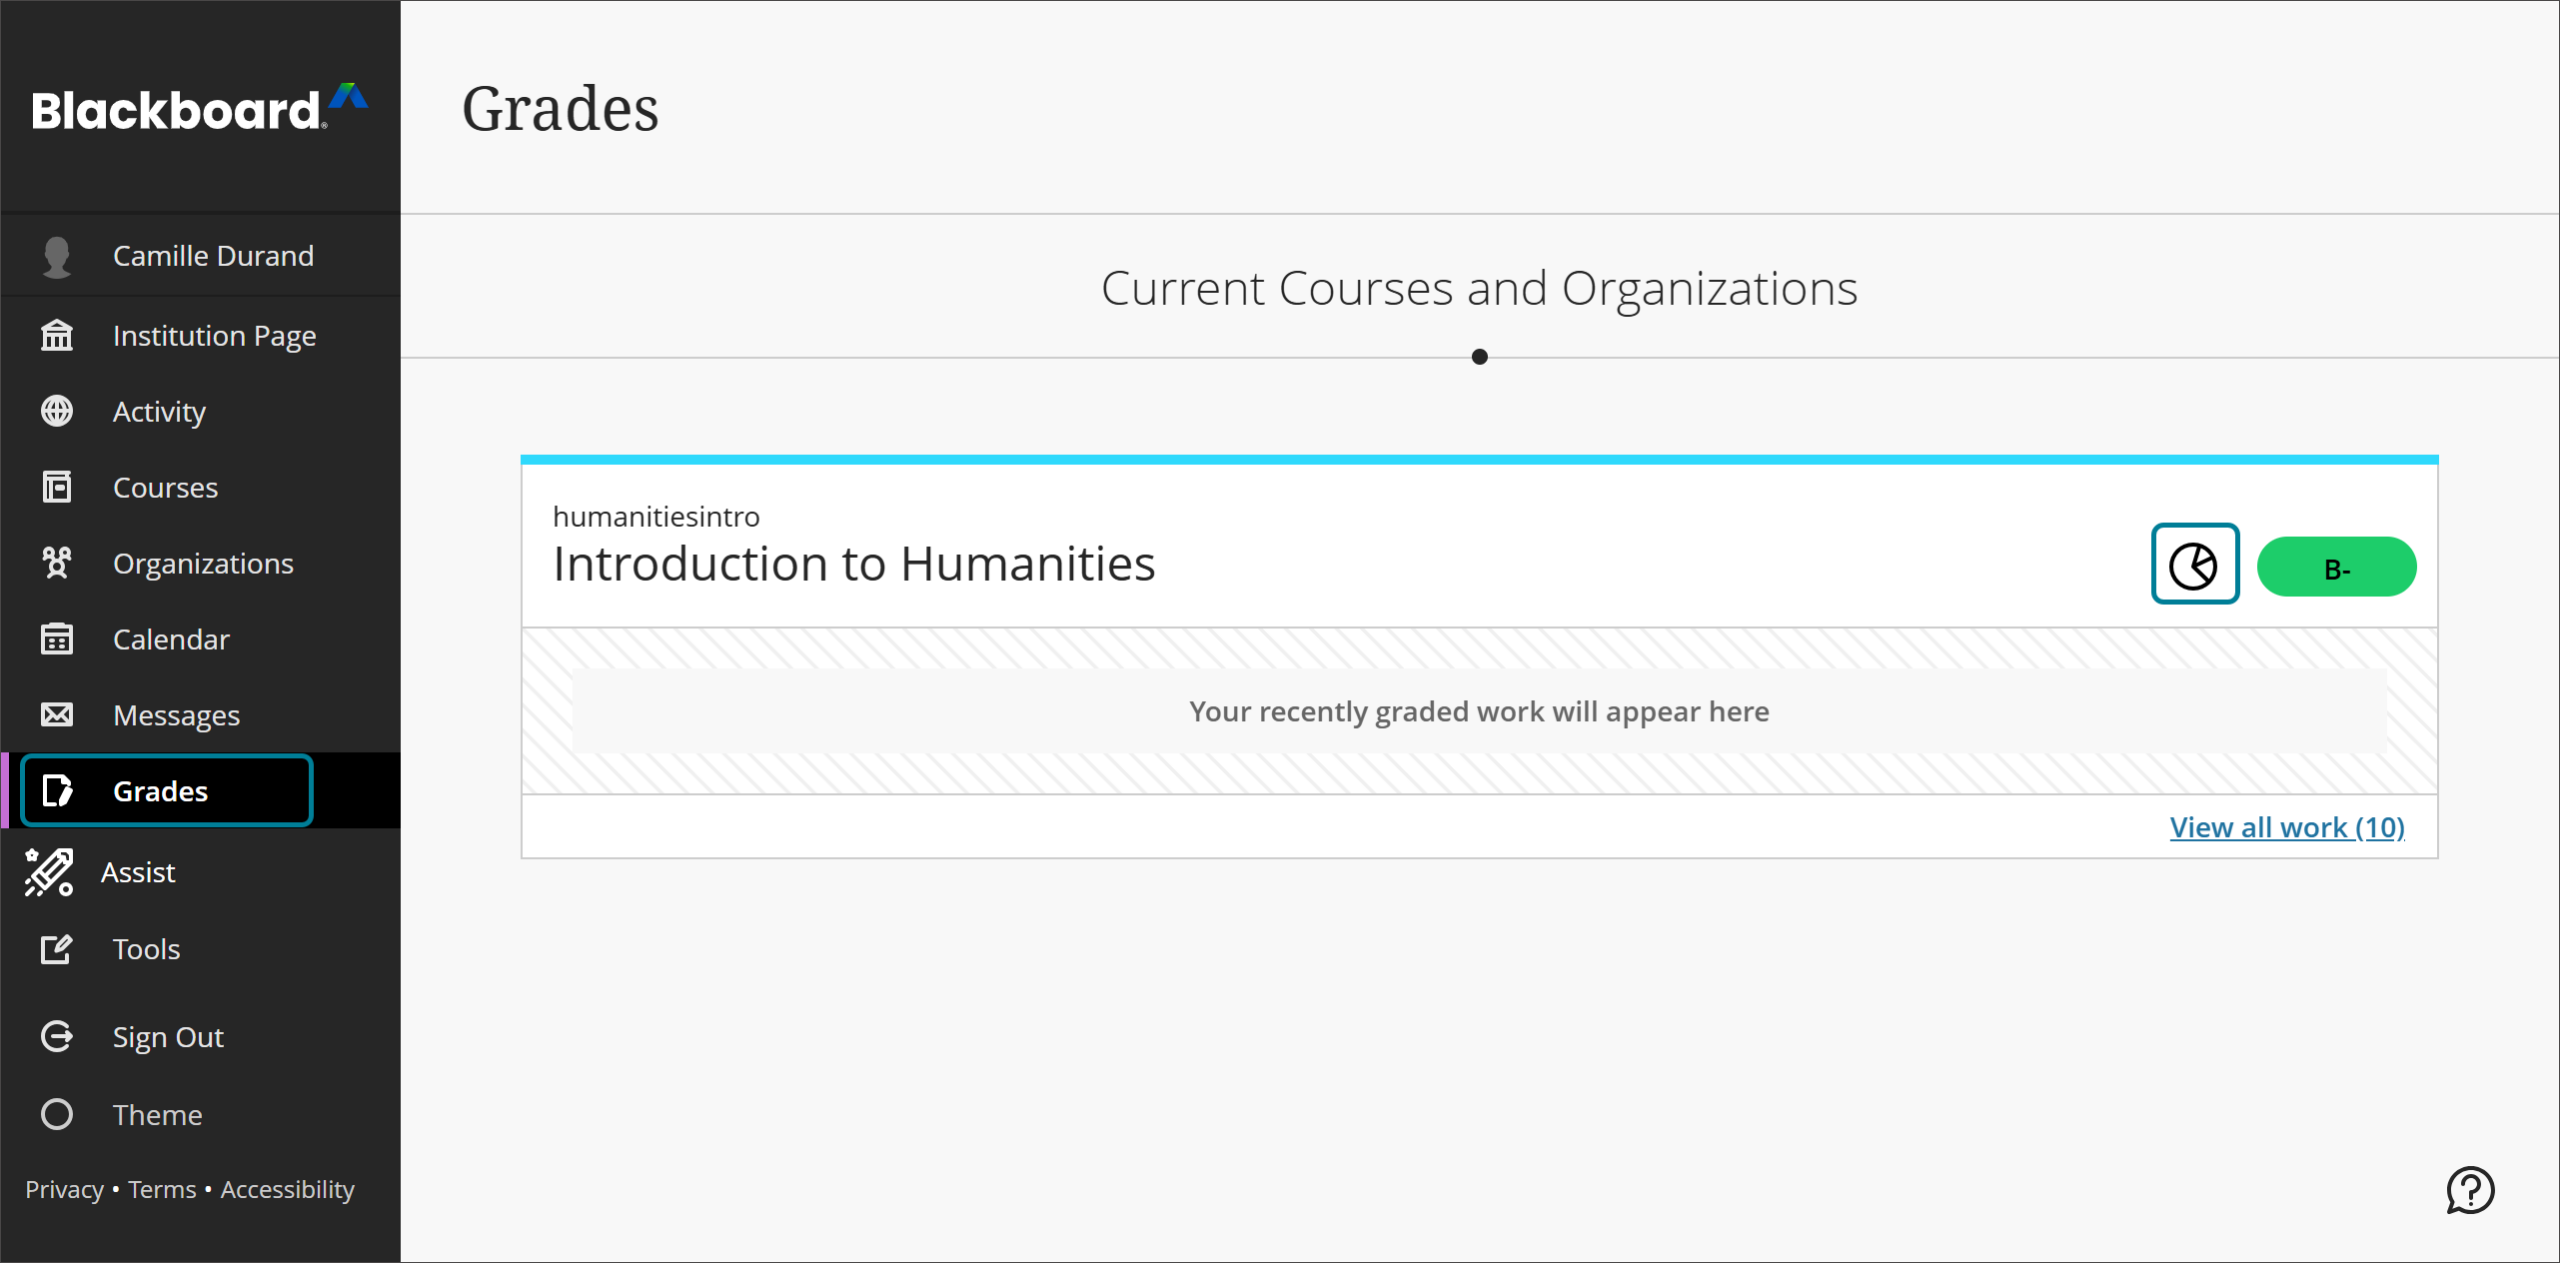
Through the Grades tab
You can also access the report in the Grades section of the base navigation. Select the pie chart button next to a course.
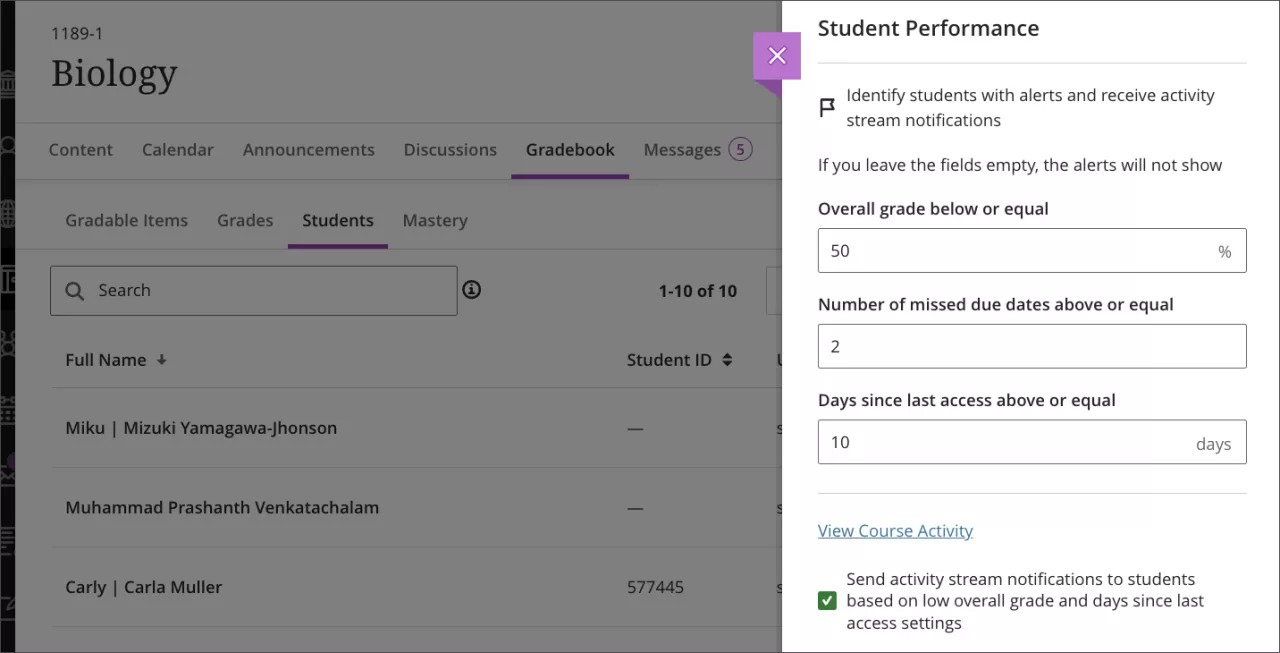
Through the Gradebook
The last way to access the Course Activity report is in the Student Performance section of the Gradebook settings. Open the settings panel by selecting the Settings button at the top of the Gradebook. Select View Course Activity.

Table view
After students have interacted with the course and the report has data to display, you can use the table view.
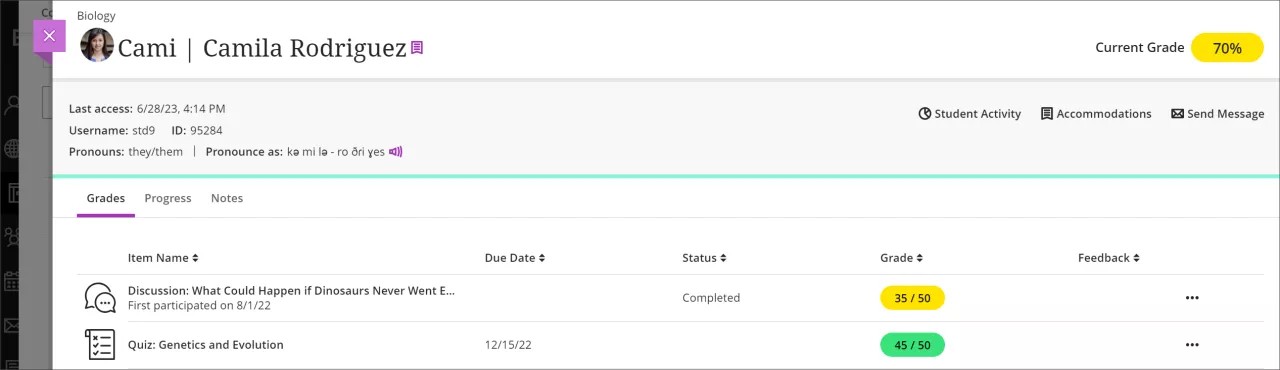
Individual student view
Select a student on the table to bring up the Student Overview to check the student’s additional information, grades, progress, and more.
Activity Stream (Real-Time Front-End Analytics)
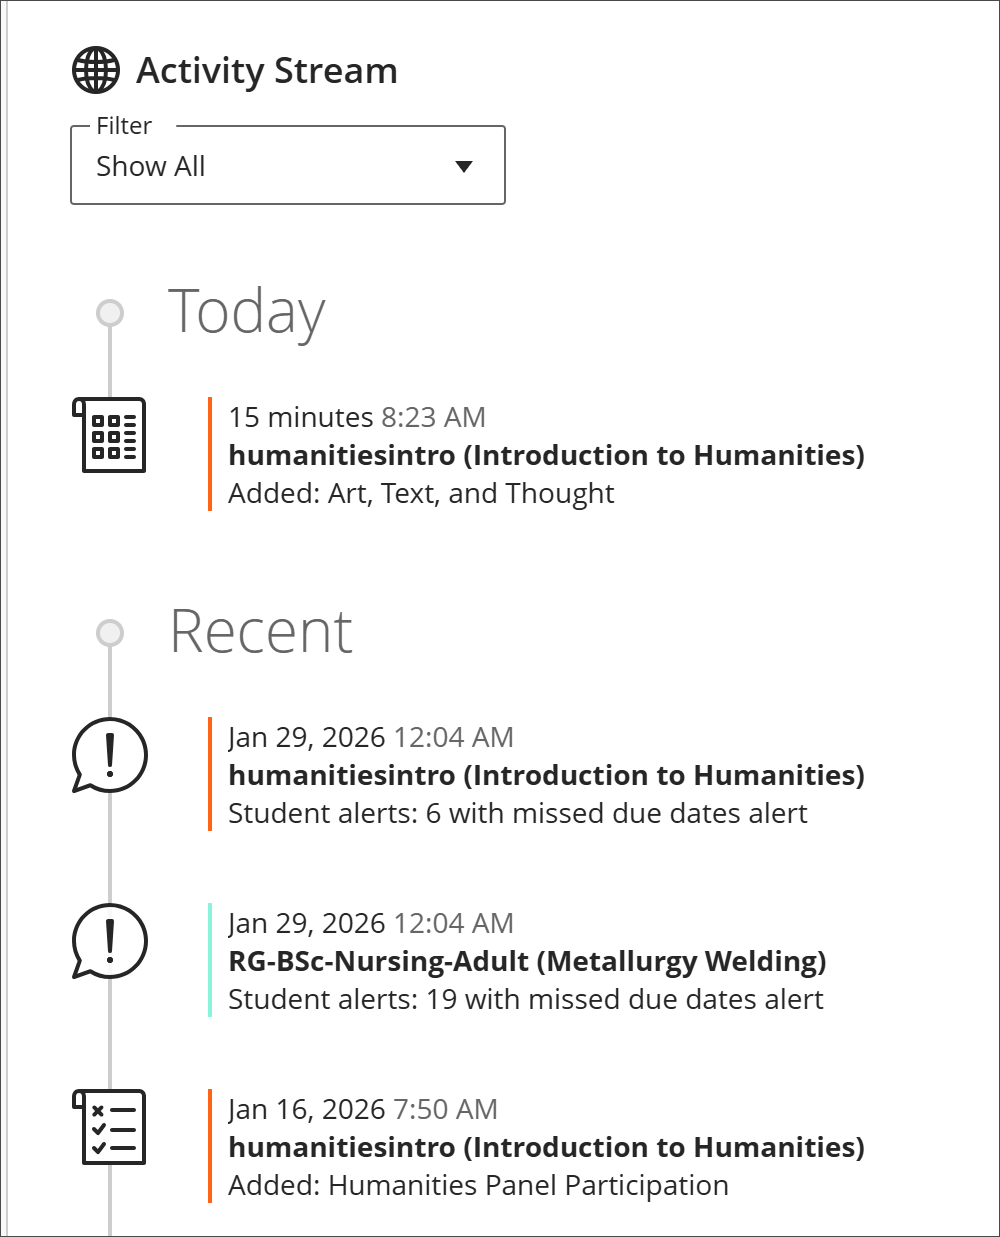
The Activity Stream functions as a real-time notification and monitoring tool, offering a continuous feed of course-related events. Unlike structured reports, it provides a dynamic, chronological view of what is happening across the course at any given moment.
This feature is particularly valuable for maintaining situational awareness. Instructors can immediately see when students submit work, access new materials, or fall behind on deadlines. Because it aggregates multiple types of activity into a single interface, it reduces the need to navigate between different course areas.
From an analytics perspective, the Activity Stream is less about deep analysis and more about immediacy—helping instructors respond quickly to emerging issues or opportunities for engagement.
Displays:
- New content and announcements
Assignment submissions and grades
Upcoming and overdue deadlines
The stream prioritises important items and acts as a live engagement dashboard for instructors and students.
Use case:
Quick awareness of what is happening across the course without opening reports.
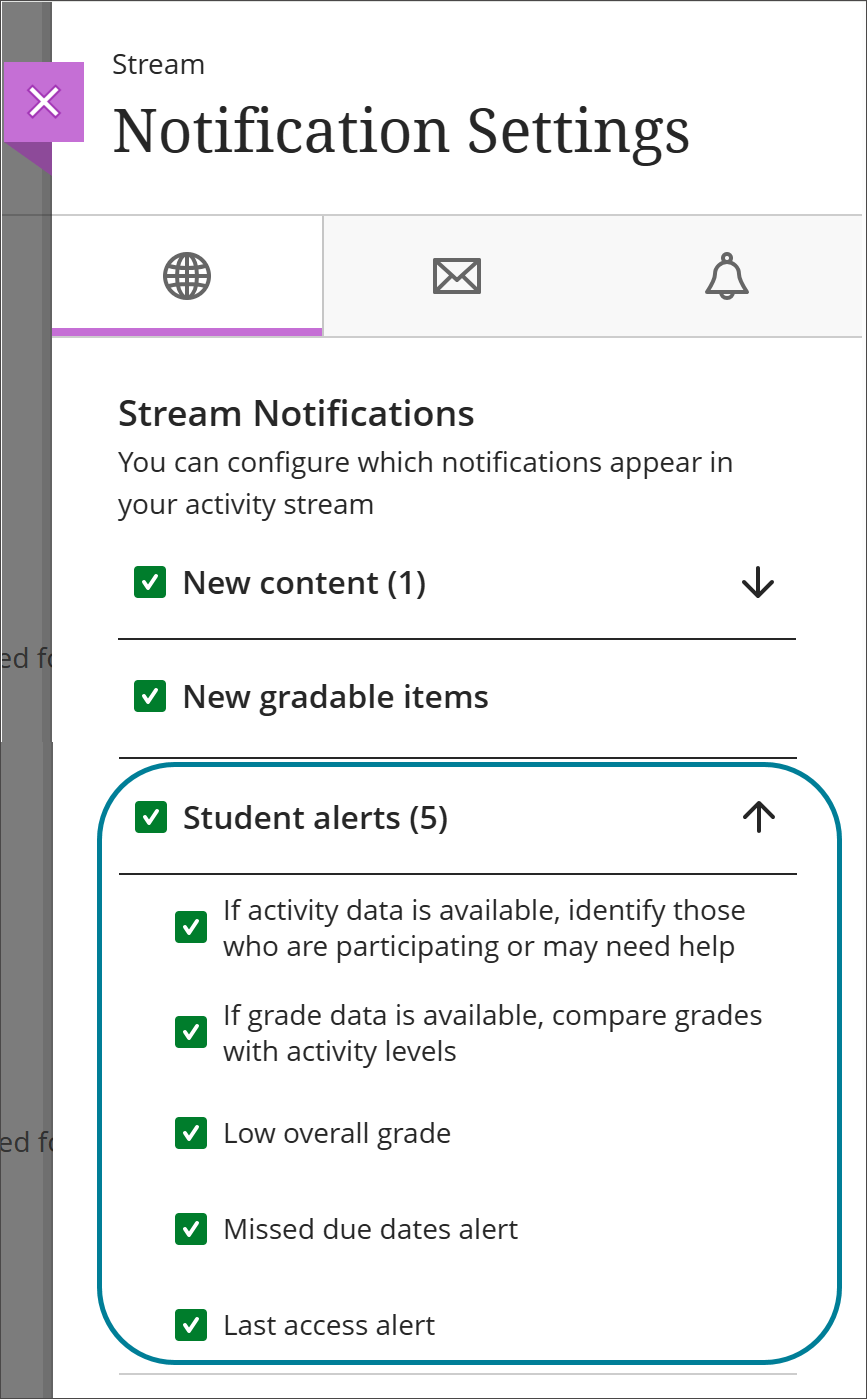
Tune notifications
You can turn these notifications off or on in your activity stream settings. Select or deselect the boxes under Student alerts to adjust the alerts related to the Course Activity report. The checkbox to the left of Student alerts applies your settings to all notifications. Open this panel by selecting the Settings button at the top of the activity stream page.
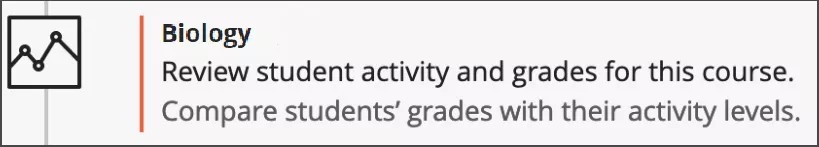
Alerts
You'll also receive a notification at the beginning of your course when there is enough activity and grade data to receive alerts. For these alerts to be sent, at least 50% of students must have at least one graded item and the specific student needs to have at least thirty minutes of activity over the past week.
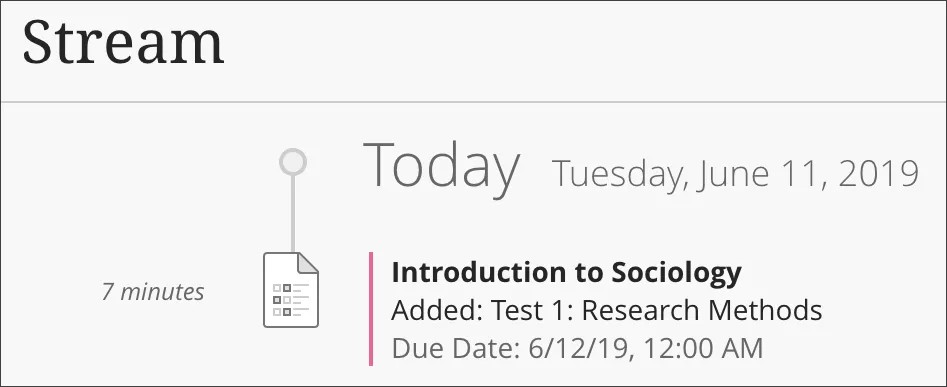
Student view
This is the student view of a single item in the Activity Stream, when something new is added to one of their courses.
Gradebook & Performance Analytics
The Gradebook in Ultra serves both as an assessment management tool and a central hub for performance analytics. It provides structured insights into how students are performing across all graded activities, with calculations and summaries automatically generated.
What distinguishes the Ultra Gradebook is its integration of analytics directly into grading workflows. Instructors do not need to switch to a separate reporting tool; instead, performance data is visible alongside grading tasks. This allows for immediate interpretation—for example, recognising that a large proportion of students performed poorly on a particular assignment.
Additionally, the ability to download grade data enables further analysis outside the platform, while still maintaining a clear overview within the interface. This balance between simplicity and flexibility makes the Gradebook a key analytical component.
Key analytics features:
- Per-student performance tracking
- Grade calculations and averages
- Downloadable assessment data (CSV/Excel)
The Gradebook also links with analytics views such as:
- Student activity profiles
- Performance trends across assessments
Use case:
Monitoring academic progress and identifying patterns in assessment performance.


Accommodations
You can add accommodations for individual students, such as an exemption from assessment due dates or time limits. Use accommodations to help students progress in the course even though they may have difficulty with some requirements. To add an accommodation, go to the Students view of the gradebook. Select the More options menu at the end of a student row, and then select Accommodations to open the Accommodations panel. You can also select a student’s name to open their student overview. Then select Accommodations.

Add gradable items, calculations, or attendance
You can add gradable items, calculations, or attendance directly in the gradebook. From the Grades view, select the plus sign between rows to access the menu. From the Gradable items view, select the plus sign between columns to access the menu.
Student Activity & Individual Analytics
Blackboard Ultra allows instructors to move from a cohort-level view to a detailed individual perspective. By selecting a specific student, instructors can access a profile that combines engagement data, grades, and activity history.
This level of granularity is important for personalised teaching. Rather than relying on general trends, instructors can investigate the behaviour of individual students—for example, identifying whether a student’s low performance is linked to reduced engagement or inconsistent access.
The weekly activity logs and engagement timelines help contextualise performance, making it easier to provide targeted feedback or support. This feature is particularly useful in identifying at-risk students and tailoring interventions accordingly.
Available data:
- Individual grades and progress
- Weekly activity logs
- Engagement patterns over time
This view is accessible via:
- The Analytics tab
- The Gradebook (clicking on a student)
Use case:
Supporting personalised feedback and intervention.
Progress Tracking (Content Engagement)
Progress Tracking shifts the focus from outcomes (grades) to learning behaviour (content interaction). It enables instructors to monitor how students engage with course materials, such as lecture notes, videos, or learning modules.
This feature provides a structured view of content completion, allowing instructors to see whether students have started, are in progress, or have completed specific items. Unlike traditional analytics that focus solely on assessments, this approach highlights the learning journey itself.
By understanding how students interact with content, instructors can identify potential barriers to learning—for example, if many students fail to access a key resource. This supports improvements in course design and sequencing, ensuring that materials are effectively supporting learning objectives.
Tracks:
- Whether content has been opened
- Whether it has been completed
- Progress through modules and learning materials
Instructors can view:
- Students who have not started content
- Students who are in progress
- Students who have completed items
Use case:
Understanding how students engage with learning materials, not just assessments.

Student Progress Report for course content
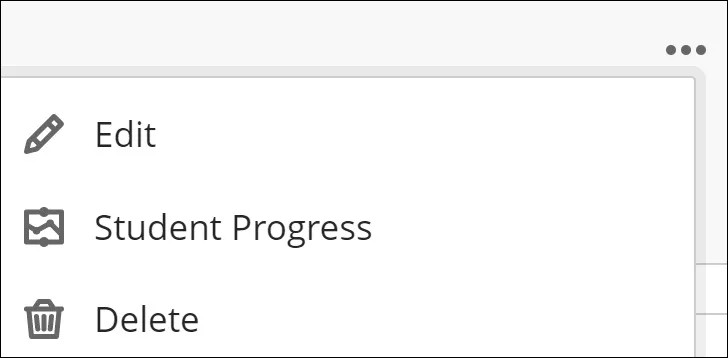
Instructors need to know how their students engage with course content other than assignments. You can then take important actions, such as improving course content or reaching out to idle students. There are two ways to access this report. The first way is to select the ellipsis menu beside the content and then select Student Progress to access the Student Progress report.
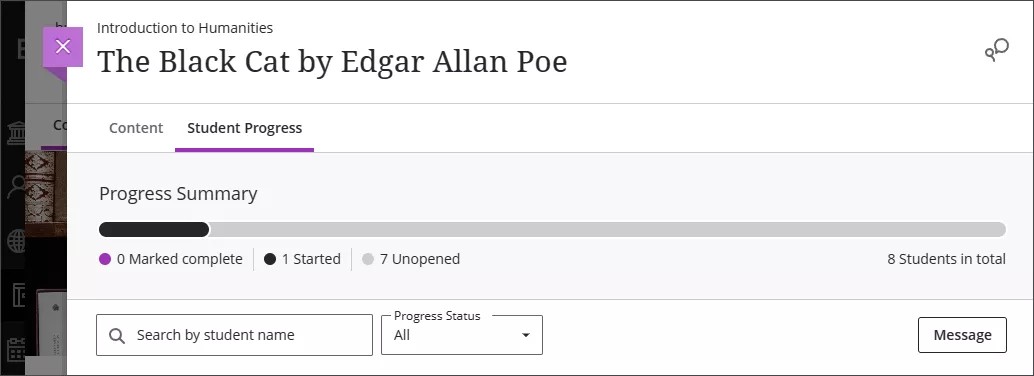
Alternative way
The second way is to bring up the content's page and then select the Student Progress tab.
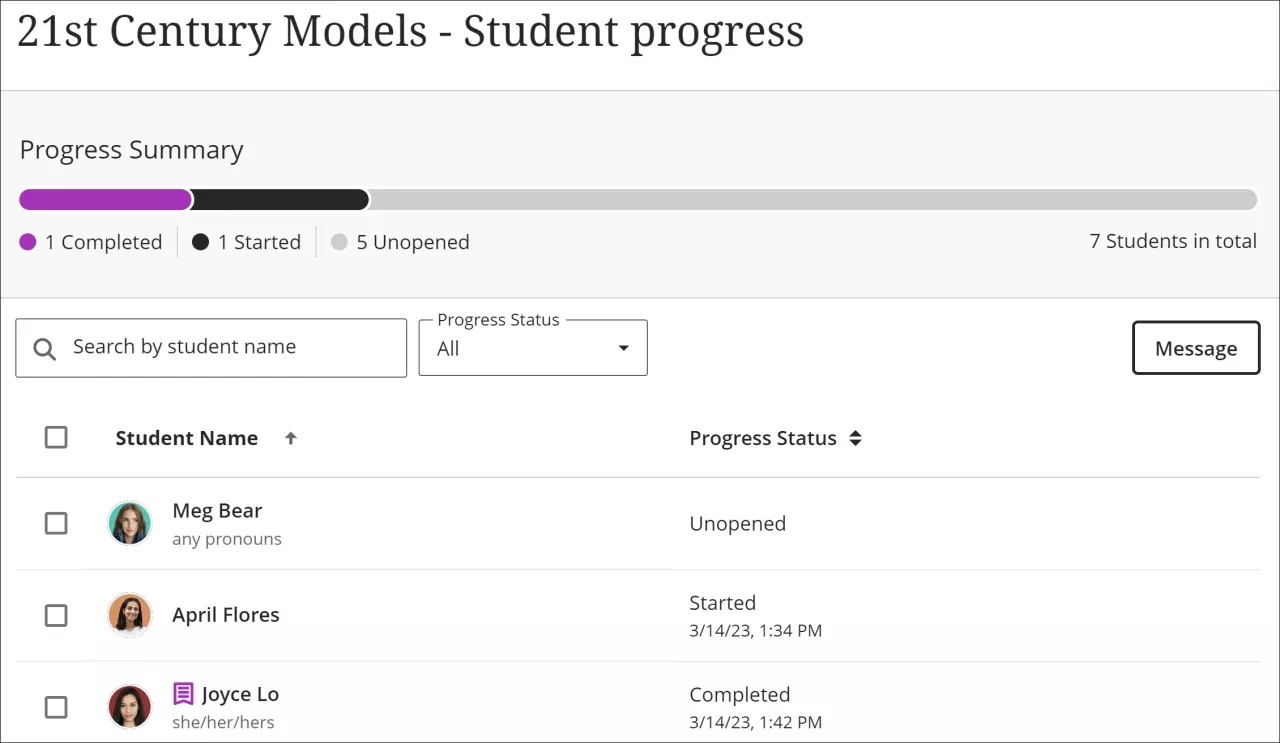
The report
The report includes the date and time an action occurred (for example, when a student first selected content or accessed content through Ally). You can sort by student name or progress status. You can act based on this information by sending an individual or bulk message. If you send a bulk message, each student receives an individual message.
Key Takeaways
Blackboard Ultra’s front-end analytics are designed to be practical, accessible, and integrated into everyday teaching activities. Rather than overwhelming users with complex data, the platform focuses on delivering clear, actionable insights that support engagement monitoring, performance tracking, and course improvement.